Much as we figured in last month’s commentary, market volatility has only increased as the current administration has sought to implement its domestic and geopolitical agendas. Hard to tell what’s driving the turbulence, though we’d have to think that folks are more concerned about the potential for tariff policy to upset the domestic growth cart. Regardless the source of growing aversion to risk, we’ve hosted a few more chats than normal with folks wondering whether they should lighten the risk load in their portfolios. During those discussions:
- Our work to address such concerns…no different, really, than any other occasion…seeks to balance desires to avoid near- and medium-term losses against the potential costs in terms of expected longer-term return to shifting a greater portion of portfolios to fixed income
- Those feeling skittish may find comfort in reasonably stable shorter-term interest rates. While the relative cost in terms of a reduction in expected return is smaller than it was a few years ago, however, it is not zero
- But as the ever-present potential for meaningful losses remain non-zero as well, whether providing confirmation or redirection, reviewing the math can support continued progress toward financial goals
Hindsight 20/20…
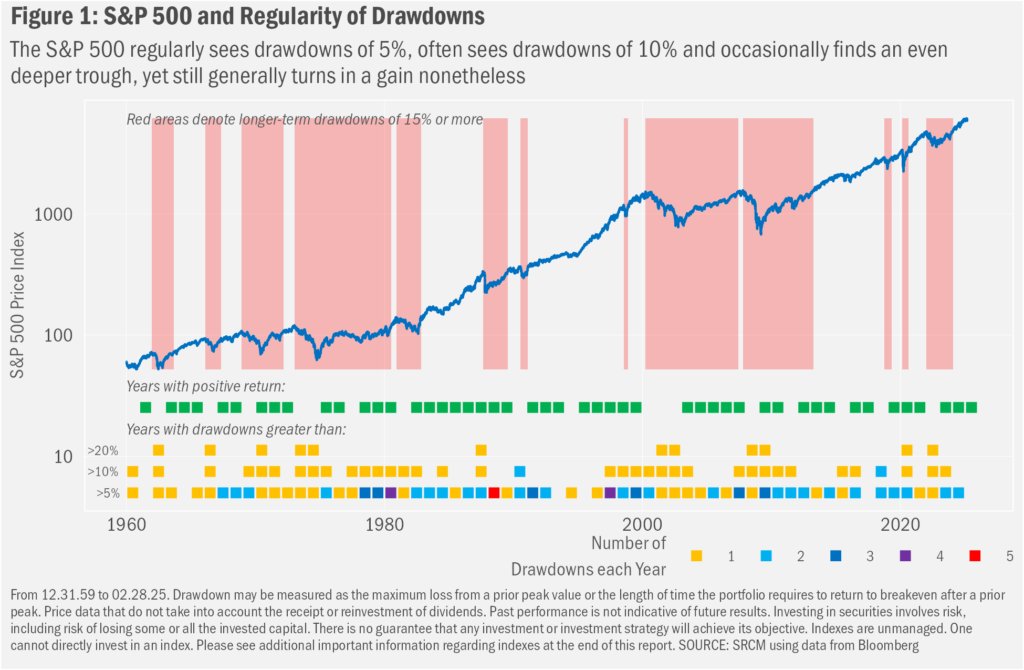
Now that it’s hard to even see the horse that left the barn, we’ll offer the reminder that, regardless of one’s temperament, shoulda-woulda-coulda moments are an unavoidable part of investing. Market history is littered with occasions—perhaps like this very moment in time—when a bit more caution a few weeks ago could have saved a fair bit of downside (please see Figure 1). Of course, that same chart shows that time generally heals those wounds. Taken together, one finds that the preponderance of shoulda-woulda-coulda moments is among the core rationale for expecting any return from our investments at all. That is, the risk of interim loss is expressed in the perceived discount one pays today for assets expected to be worth more and/or provide income to us for our ownership over time.

…Blind to the Future, We Are
That doesn’t mean that everyone experiences the same level of discomfort when the stocks they own are down close to 10%. Happily, we can modulate portfolio exposure to risk in its various forms and relative heft with the intention of relieving some of the mental burden that market drawdowns present. But as risk and return can be seen as having a mostly direct relationship, there is a cost in terms of expected return to a reduction in assumed risk, just as there’s a cost in terms of relative stability that comes along with an increase in expected return.
For bonds, expected return calculations are relatively straightforward in that they arise from one or both of an increase (or decrease, in the case of bonds purchased at a premium) in the value of the bond over time and the interest income that the bond pays over time (its yield, which might be consumed or reinvested). From the time of purchase to the time of maturity, however, the price of a bond will fluctuate for reasons other than a gradual drift in its price toward face value, including changes in interest rates and in the solvency of the issuer (with U.S. Treasury bonds generally being perceived as being free of the latter). Still, so long as the issuer doesn’t default (fail to make a coupon payment or to pay the face value when the bonds mature), an investor has a pretty good sense of the return to be realized from a bond that’s held to maturity. The range of interim values, therefore, is relatively narrow, while the eventual outcome of ownership to maturity is reasonably well defined upon purchase.
Interim and eventual returns for stocks, on the other hand, are wild by comparison. That’s primarily because the only agreed-upon value for a stock price is the current one. And the price is set by ongoing demand for the stock, which can change for myriad reasons. The foremost of those is the broader appetite for equity risk. For example, while investors have been happy to take on equity risk over the past two years, the current market downturn suggests a good bit of that enthusiasm has waned. Amidst growing concerns related to geopolitics (centered on the war in Ukraine), the stability of inflation (not trending down as quickly as investors may have hoped), and the potential impacts of fiscal policy shifts (mostly regarding tariffs), the U.S. stock market has dropped more than 4% so far this year, as measured by the large-cap-focused S&P 500 Index, and is now down just under 9% from its February 19 peak.
Importantly, investors generally consider equity risk more broadly in the context of risks presented by other asset classes. Ultimately, we see changes in investor assessment of relative risk/reward potential being reflected across stocks in general, with all stocks moving more or less in the same direction for some reason. We also find stock performance to differ on a relative basis, as investors will find some portion of individual stock volatility and returns attributable to characteristics specific to that company. That’s because investors also consider the “idiosyncratic” risks a company presents—meaning those risks specific to the company—including aspects of their operations and management, as well as realized and projected fundamental growth (e.g., revenue, margins and profit), among many others. All these characteristics and assessments change over time, too.
So, while the broader U.S. equity market has sold off since February, some stocks have fallen much further. Consider shares in two market darlings of 2024: carmaker Tesla Inc. (TSLA) and Nvidia Corp. (NVDA). The former are off 54% from their 12.17.24 peak, versus a 7% decline for the S&P 500 over that same period, while the latter are down more than 28% from their 01.06.25 acme, during which time the S&P 500 fell just under 6%. The core theme for the declines in the stock prices of these two very different companies, arguably, has been a shift lower in growth expectations for both and therefore in the present value investors ascribe to the businesses.
Balance Risk We Can
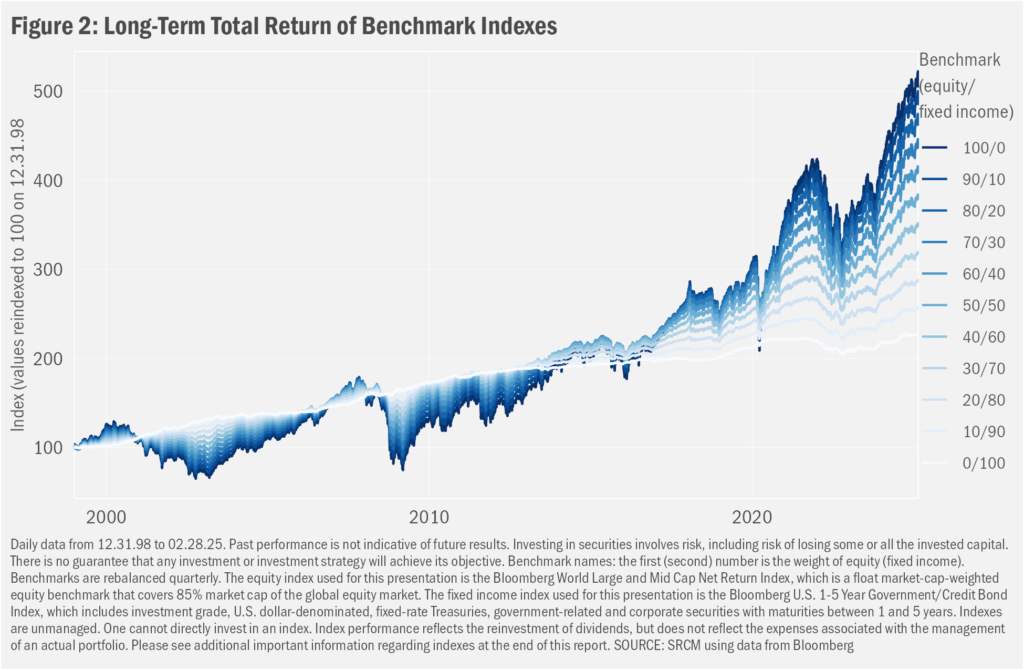
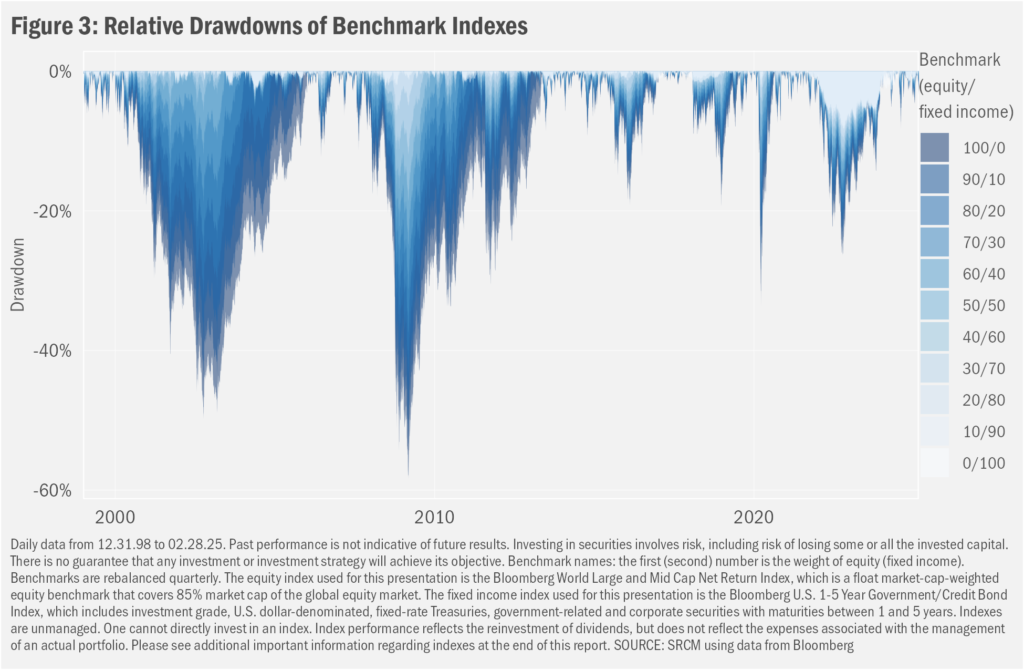
The distinct potential risk/reward characteristics of stocks and bonds serve as the basis for our investment strategies, which generally focus on 1) stocks for long-term total return (capital gains plus dividends) and 2) bonds for income and portfolio stability. As we show in Figure 2 using risk-specific benchmarks for our strategies, the larger the allocation to stocks in a portfolio, generally speaking, the greater the long-term return. The greater, too, the risk, a feature reflected in Figure 3 by the larger drawdowns for riskier benchmarks. Thus, having a range of portfolios across the risk spectrum allows us to implement portfolios that are applicable to individual client aversion to investment risk, even as that aversion may change through time.


Seasons Change. People Change.
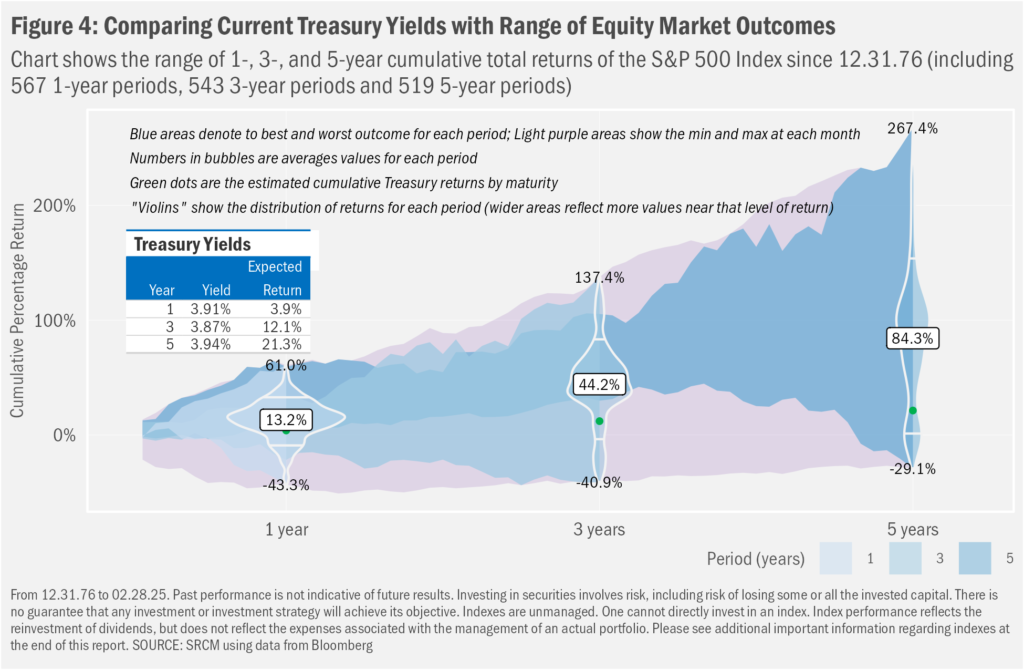
Speaking of changes in investor appetite for risk, we offer the data in Figure 4 for those wanting to better understand the potential implications of a shift lower in portfolio equity allocation. The historical results we show in Figures 2 and 3 are just that: what we’ve experienced in the past. While we continue to believe that they are indicative of potential future returns on a relative basis (e.g., stocks, versus bonds), we cannot be sure of that. Even more, we have no idea what the absolute returns of stocks will be on a going-forward basis. We do, however, have a good sense of what returns for risk-free Treasures may be when held to maturity. In Figure 4 we show expected total returns for Treasury Bills and Notes with maturities of 1, 3 and 5 years, which are all about 3.9% on an annual basis, and 3.9%, 12.1% and 21.3% on a cumulative basis if held to maturity (and assuming reinvestment of any coupons at the original yield, which is not guaranteed).

Stocks, on the other hand, have shown a simple average cumulative return across all rolling 1-, 3- and 5-year periods since 1976 of 13.2%, 44.2% and 84.3%, respectively (or 13.2%, 13.0% and 13.0% annualized, in that order). Looking beneath those averages, however, one sees a wide range of outcomes. Over all 519 rolling 5-year periods, the maximum cumulative return was 267.4% (29.7% annualized), while the minimum was a cumulative 29.1% loss (6.6% annualized). Nonetheless, as we show using the “violins” on the same chart, the bulk of returns (as expressed by the width of a violin at each level of return) lies well on the positive side of the ledger. So, while we’ve seen negative outcomes across each of the presented periods, they have appeared less often than positive ones.
So, the question becomes how much expected return—an estimation of which probably should sit within a range of outcomes both strongly negative and strongly positive—would one be willing to give up for the relative stability of and confidence in the return expected from a Treasury bill. For some, that tradeoff will make sense. For others, the potential cost may warrant retaining the existing portfolio allocation with the expectation that this downturn—as has been the case for all others before it—too, may prove temporary.
Important Information
Statera Asset Management is a dba of Signature Resources Capital Management, LLC (SRCM), which is a Registered Investment Advisor. Registration of an investment adviser does not imply any specific level of skill or training. The information contained herein has been prepared solely for informational purposes and is not an offer to buy or sell any security or to participate in any trading strategy. Any decision to utilize the services described herein should be made after reviewing such definitive investment management agreement and SRCM’s Form ADV Part 2A and 2Bs and conducting such due diligence as the client deems necessary and consulting the client’s own legal, accounting and tax advisors in order to make an independent determination of the suitability and consequences of SRCM services. Any portfolio with SRCM involves significant risk, including a complete loss of capital. The applicable definitive investment management agreement and Form ADV Part 2 contains a more thorough discussion of risk and conflict, which should be carefully reviewed prior to making any investment decision. Please contact your investment adviser representative to obtain a copy of Form ADV Part 2. All data presented herein is unaudited, subject to revision by SRCM, and is provided solely as a guide to current expectations.
The S&P 500 Index measures the performance of the large-cap segment of the U.S. equity market.
The opinions expressed herein are those of SRCM as of the date of writing and are subject to change. The material is based on SRCM proprietary research and analysis of global markets and investing. The information and/or analysis contained in this material have been compiled, or arrived at, from sources believed to be reliable; however, SRCM does not make any representation as to their accuracy or completeness and does not accept liability for any loss arising from the use hereof. Some internally generated information may be considered theoretical in nature and is subject to inherent limitations associated thereby. Any market exposures referenced may or may not be represented in portfolios of clients of SRCM or its affiliates, and do not represent all securities purchased, sold or recommended for client accounts. The reader should not assume that any investments in market exposures identified or described were or will be profitable. The information in this material may contain projections or other forward-looking statements regarding future events, targets or expectations, and are current as of the date indicated. There is no assurance that such events or targets will be achieved. Thus, potential outcomes may be significantly different. This material is not intended as and should not be used to provide investment advice and is not an offer to sell a security or a solicitation or an offer, or a recommendation, to buy a security. Investors should consult with an advisor to determine the appropriate investment vehicle.

