
With the new U.S. presidential administration comes a range of distinct methods of governing. Among that list is a seemingly blunt-force approach to trade management that over the past few days has resulted in more than a few market gyrations. We could discuss the specifics, but as soon as we might, they’re likely to change. Instead, we’ll offer the reminder that stocks are volatile and likely will forever remain so. And stocks sometimes are more volatile than other times. These may be among those more volatile times. That warning in mind, we offer the following reminders:
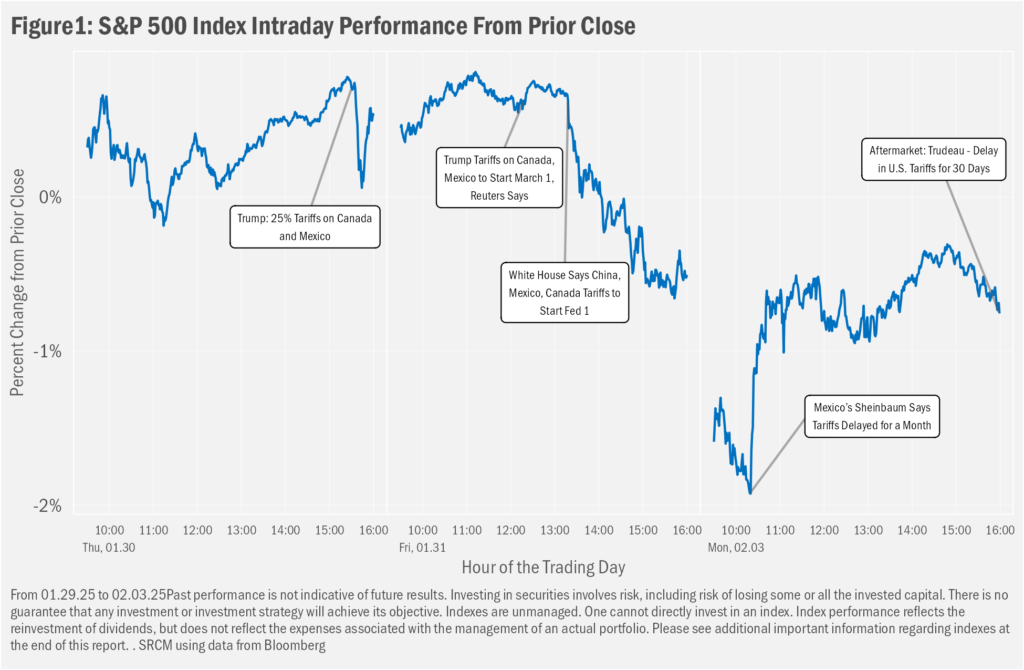
- Intraday volatility normally goes unobserved by the average investor, but we think actions during the early months of this administration will keep the spotlight on market shifts during the day
- As the past few days demonstrate, though, one can argue the gyrations leave investors back where they might otherwise have been
- Which is the sort of pattern we tend to see over longer-term time horizons, such that we think the better approach is to limit attention to market moves as the administration’s intentions become clearer and, more importantly, its policies are more durably implemented
Shaking Things Up
As the headlines bounced between suggestion, expectation, revelation, refutation, implementation and suspension of the Trump administration’s tariff-oriented trade policies, so, too, did the U.S. equity market and those of the tariff-target countries, along with their respective currencies. We’d argue that the on-balance interpretation is that the market is probably unhappy with the approach, which broadly has resulted in expanded market volatility, while remaining skeptical of the likelihood of implementation at the more extreme ends of the potential policy spectrum. That is, the market is off earlier peaks, but not by too much, in the meantime having bounced around on each fresh headline. Investors may dislike the rapid-fire nature of it all, but the volatility shouldn’t be interpreted as anything abnormal.
In Context, Within Bounds
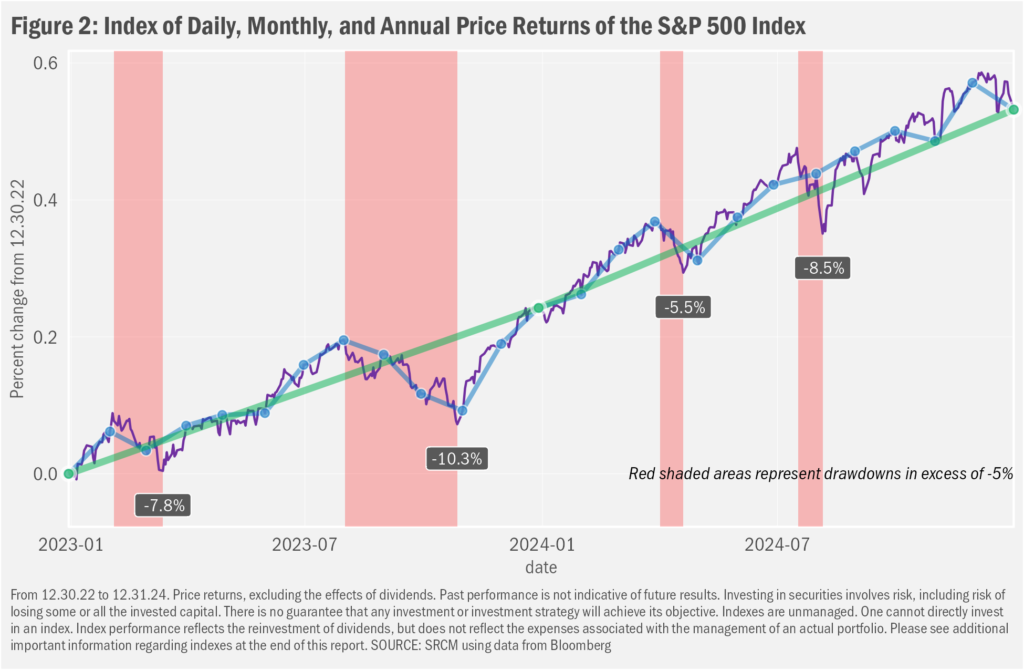
Generally not as abrupt as those we’ve experienced over the past few days, intra-year market moves can be rather large, even during a time frame over which the market generally rose. Take the last two-year period for example. In Figure 2 we show the performance of the S&P 500 since the end of 2022, over which time the index has gained 54%. But the index saw four drawdowns—interim losses from a prior peak—that exceeded 5%. U.S. large-cap stocks, which the index is built to represent, even saw a “correction” over the second half of 2023, loosely defined as a drawdown of 10% or more. For the historically above-average return of the past two years, investors have had to endure no small amount of volatility.
Right Frame of Mind
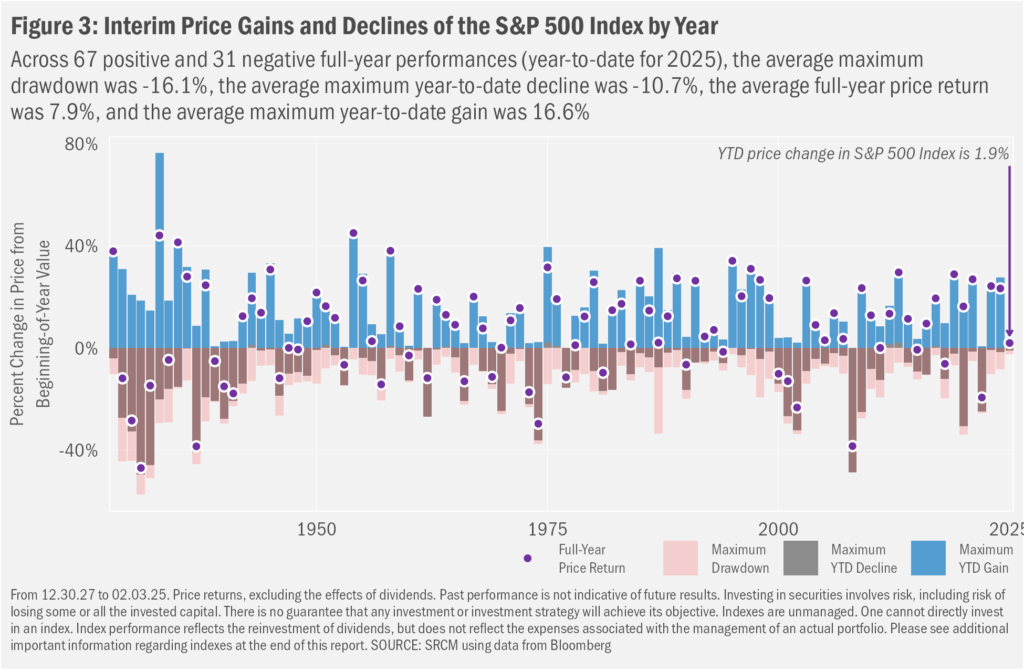
Zooming out on market history, as we do in Figure 3, one can see that the U.S. stock market has experienced a wide range of interim results over most years. Take 2016, the year prior to Donald Trump’s first term. Off a bit before the year began, not including dividends, the S&P 500 was down more than 10% by mid-February but closed the year 9.5% higher than its level at the end of 2015, up more than 22% from the February 11 bottom. And in 2018, the market was flattish on a price basis through April, up 9.6% year-to-date by late September, down on the year by more than 12% on Christmas Eve, but finished the year down only 6.2%.
We don’t suggest anyone should expect to find the next few months comfortable. But that recommendation has little to do with the sitting president. Daily, weekly, monthly and yearly ups and downs have always been part of the give-and-take of the risk-for-potential-reward trade. And we think it’s unlikely that 2025 will prove any different. Even so, we understand that investor comfort with market risk may have changed after the inauguration. While some may fear what’s to come, others may be excited by the potential policies being discussed. That in mind, we welcome discussions covering methods to adapt portfolio exposures to personal views on and individual comfort with future market risk, whatever those expectations may be.
Important Information
Statera Asset Management is a dba of Signature Resources Capital Management, LLC (SRCM), which is a Registered Investment Advisor. Registration of an investment adviser does not imply any specific level of skill or training. The information contained herein has been prepared solely for informational purposes and is not an offer to buy or sell any security or to participate in any trading strategy. Any decision to utilize the services described herein should be made after reviewing such definitive investment management agreement and SRCM’s Form ADV Part 2A and 2Bs and conducting such due diligence as the client deems necessary and consulting the client’s own legal, accounting and tax advisors in order to make an independent determination of the suitability and consequences of SRCM services. Any portfolio with SRCM involves significant risk, including a complete loss of capital. The applicable definitive investment management agreement and Form ADV Part 2 contains a more thorough discussion of risk and conflict, which should be carefully reviewed prior to making any investment decision. Please contact your investment adviser representative to obtain a copy of Form ADV Part 2. All data presented herein is unaudited, subject to revision by SRCM, and is provided solely as a guide to current expectations.
The S&P 500 Index measures the performance of the large-cap segment of the U.S. equity market.
The opinions expressed herein are those of SRCM as of the date of writing and are subject to change. The material is based on SRCM proprietary research and analysis of global markets and investing. The information and/or analysis contained in this material have been compiled, or arrived at, from sources believed to be reliable; however, SRCM does not make any representation as to their accuracy or completeness and does not accept liability for any loss arising from the use hereof. Some internally generated information may be considered theoretical in nature and is subject to inherent limitations associated thereby. Any market exposures referenced may or may not be represented in portfolios of clients of SRCM or its affiliates, and do not represent all securities purchased, sold or recommended for client accounts. The reader should not assume that any investments in market exposures identified or described were or will be profitable. The information in this material may contain projections or other forward-looking statements regarding future events, targets or expectations, and are current as of the date indicated. There is no assurance that such events or targets will be achieved. Thus, potential outcomes may be significantly different. This material is not intended as and should not be used to provide investment advice and is not an offer to sell a security or a solicitation or an offer, or a recommendation, to buy a security. Investors should consult with an advisor to determine the appropriate investment vehicle.
